How Capuchin works
Five modules. All running automatically from your live ticketing data.
Five modules. All running automatically from your live ticketing data.
A short setup. Then it runs itself — and the decisions stay yours. Connect your ticketing data, set your capacity, and Capuchin handles the rest. No spreadsheets. No weekly rebuilds. Just the answers to the questions you're actually asking — before you have to ask them.
Want to see it on your own data? Book a 30-minute demo.
Capuchin integrates directly with your ticketing provider. Currently supported: Weeztix and Paylogic. Additional integrations on request.
Setup takes 1–3 days. We handle the technical side. Once connected, Capuchin starts learning from your sales history and runs automatically from that point forward.
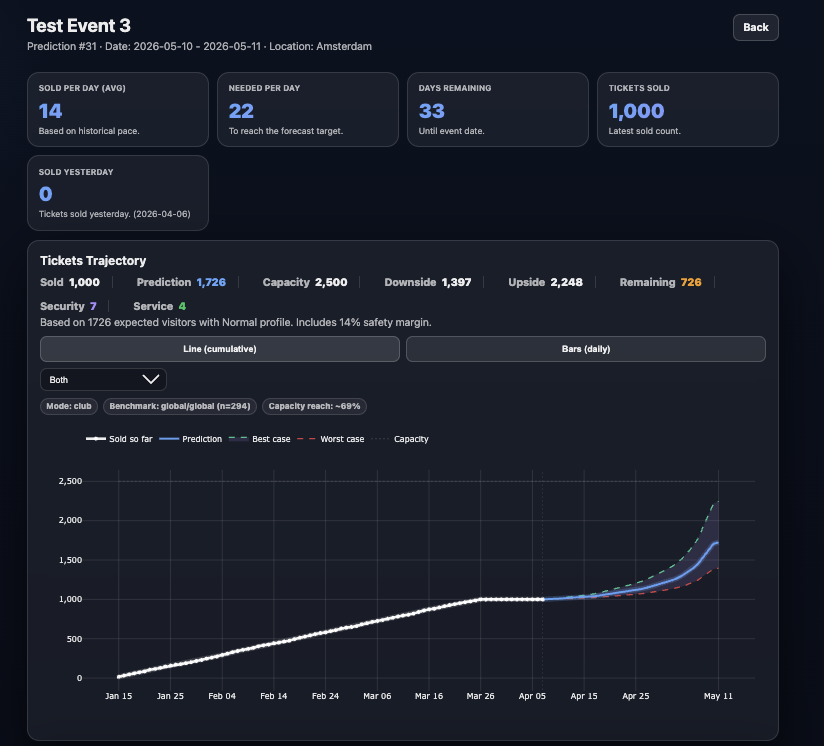
Live, automatic, three scenarios
Manually refreshing dashboards, comparing to last year's spreadsheet, gut-feeling projections
Capuchin reads your current sales velocity and compares it against your own historical event patterns. Four windows drive the analysis: after the first week of sales (announcement momentum), mid-sales pacing, the three-week-out position, and final-week velocity. The opening window activates once enough data exists to read real momentum rather than noise. Each window tells a different story about where you're heading.
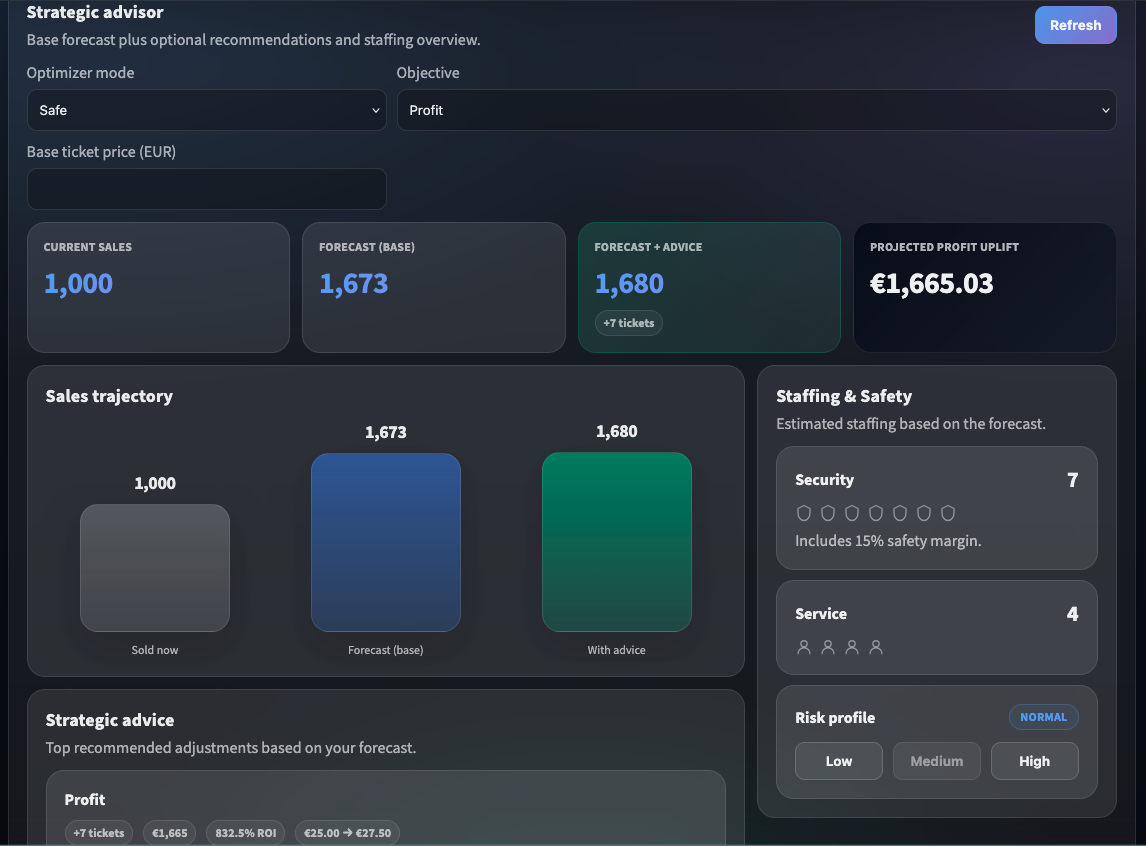
Concrete triggers, not abstract charts
Hours spent interpreting data manually, relying on memory for what worked before, reactive decisions taken too late
Capuchin compares your current pacing against what's worked before for your events, then surfaces direct recommendations. You set the mode (Safe or Aggressive) and the objective (Profit or Attendance). It runs the numbers. You make the call.
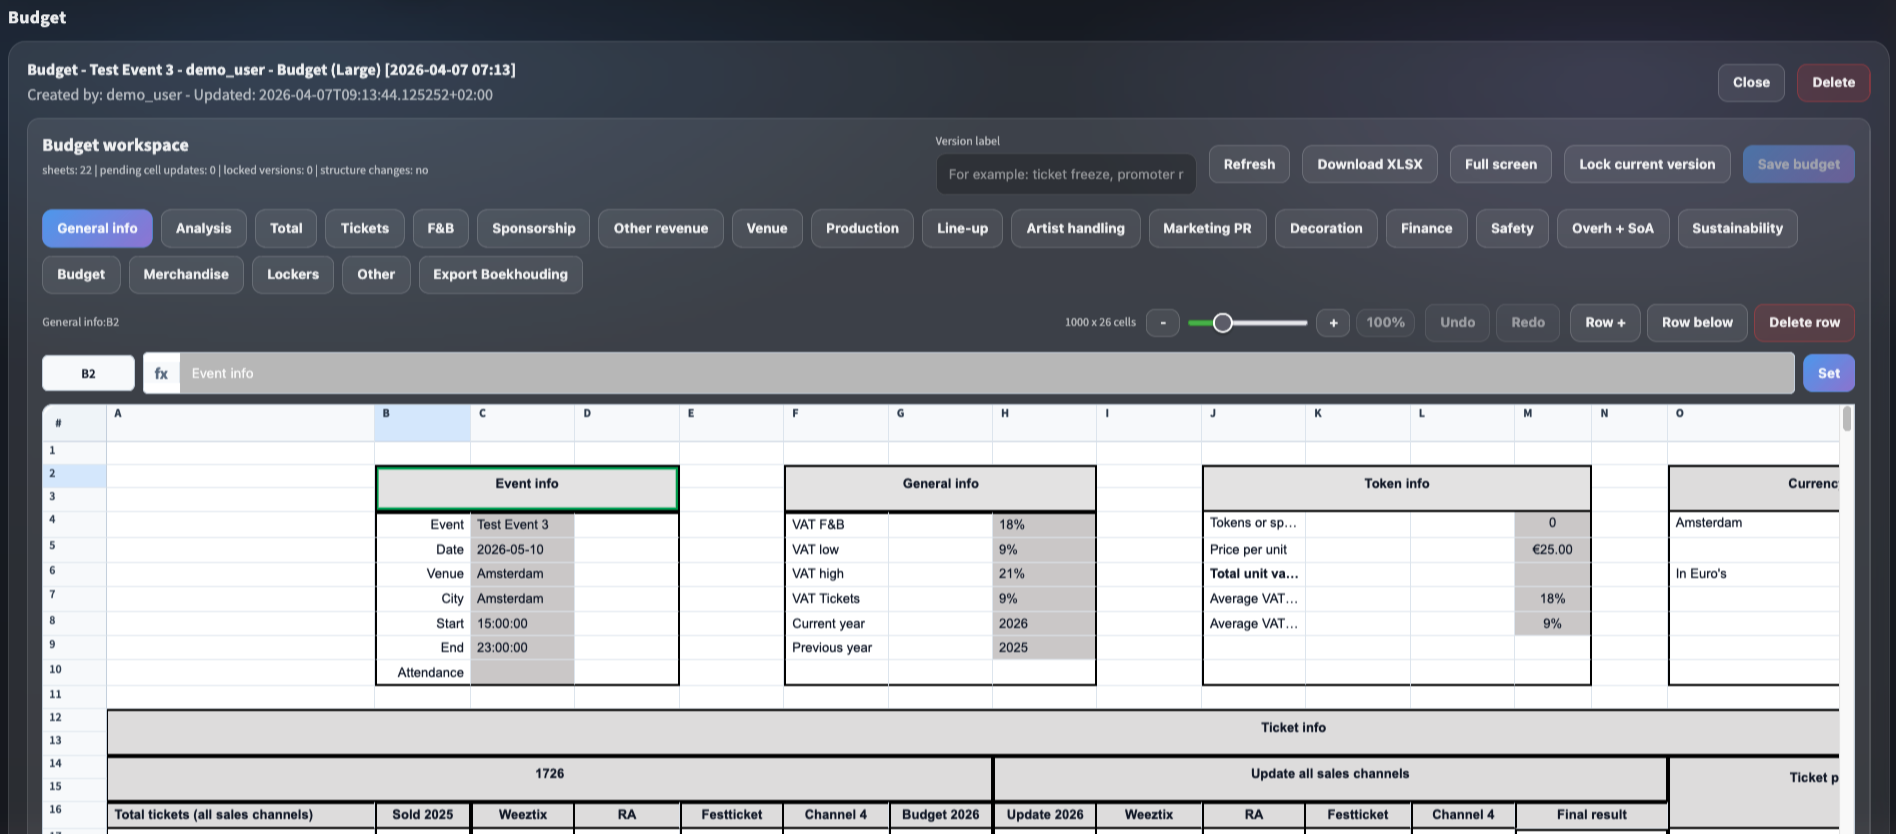
Your forecast and your budget, speaking the same language.
Rebuilding the budget spreadsheet every Monday, manually updating ticket revenue lines, discovering mismatches too late to act
Capuchin's forecasts feed directly into your budget templates as starting variables — worst, average, and best case. Adjust manually where needed, save versions as your event develops, and always know where your numbers come from.
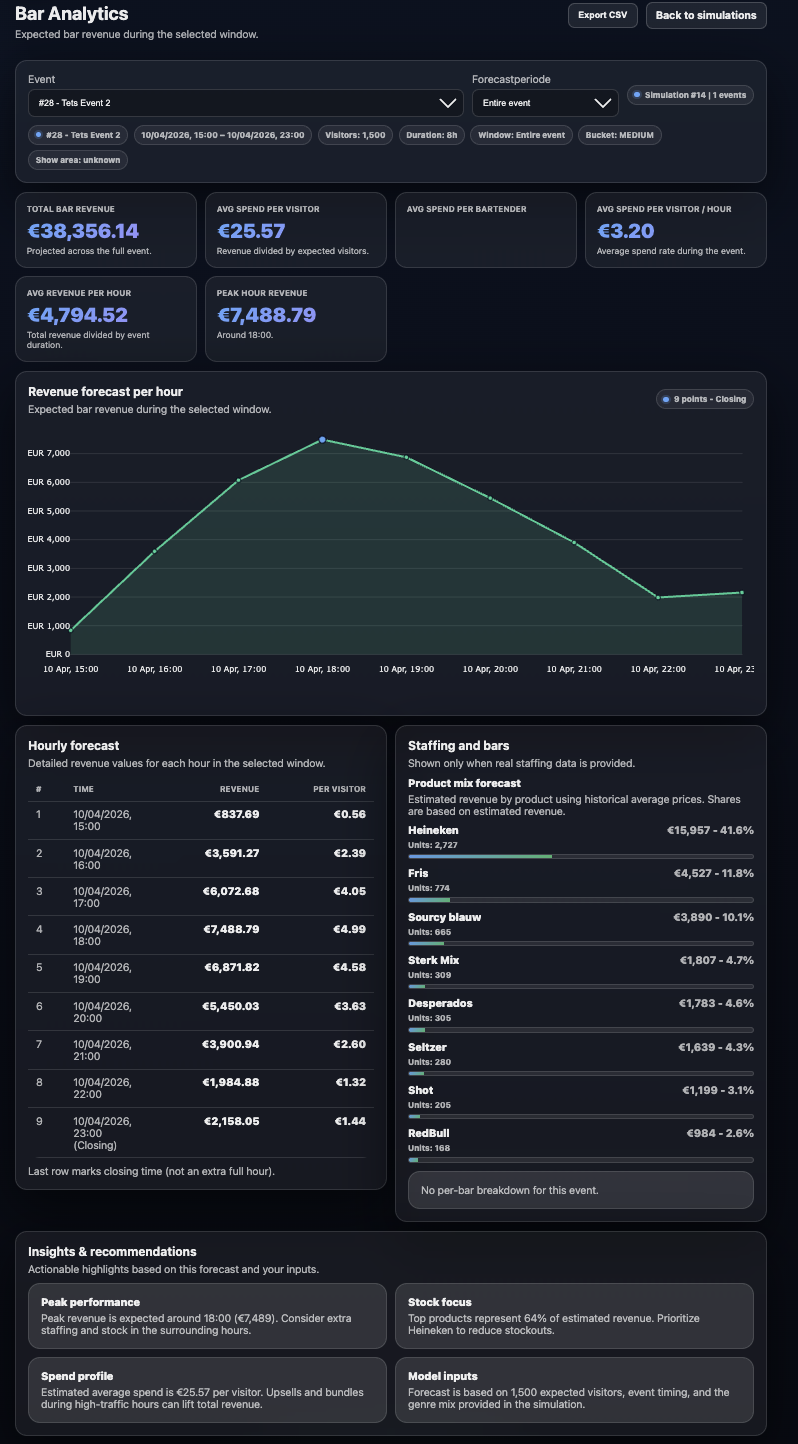
Know what to order before doors open
Ordering based on last time, over-ordering to be safe, discovering stock mismatches on the night
Hourly revenue forecasting across the full event window. Product mix breakdown. Peak hour identification. Staff implications. Output: a procurement recommendation you can act on before you place the order.
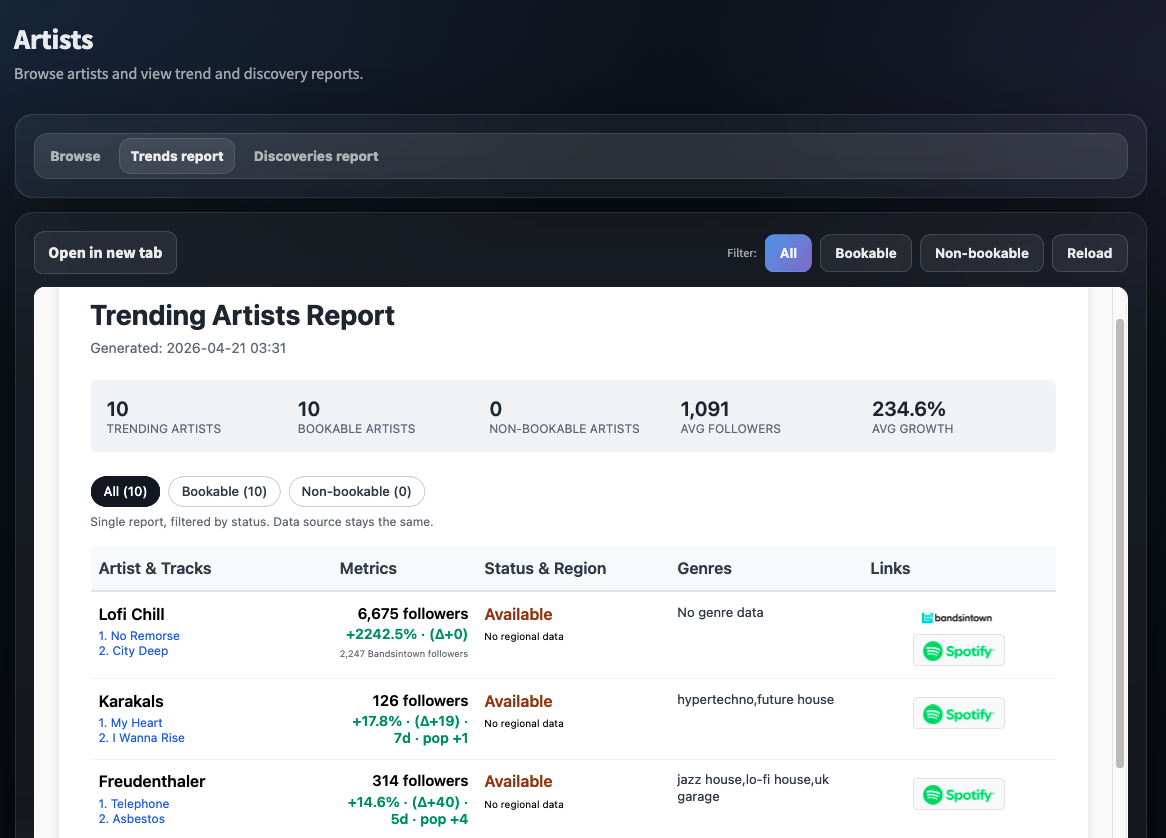
Surface emerging acts before the market does
Manual A&R research, relying on agent recommendations, missing acts before prices rise
Discovery reports matched to your genre and audience profile. Trend signals showing what's gaining momentum in your market. The goal: book the right artist before the price reflects the demand.
Want to see more? Every module looks better on real data.
Get in touch →Capuchin's insights are only as deep as the data behind them. A new client starts with solid sector-level patterns. A client with two years of event history gets something far more precise — forecasts calibrated to their own venues, audiences, and artist profiles.
Capuchin draws on sector benchmarks and patterns from comparable events to give you useful starting points
Your own data becomes the primary reference — your venues, your audience behaviour, your historical sales windows. Roughly from 20 events onward.
The system surfaces things you'd never see manually — micro-patterns in purchase timing, genre-specific decay curves, artist loyalty signals. From 50+ events.
The models powering Capuchin are actively built and maintained by our own ML engineers — the longer you use it, the more precisely it understands your specific context.
The best results come from treating Capuchin as a long-term partner, not a one-event tool.
Demo
30 minutes, on a scenario like yours. No slides. Just the product.
Integration
We connect Capuchin to your ticketing provider. 1–3 days, we handle it.
Three-week onboarding
Structured handover so your team owns the tool independently by the end.
Book a 30-minute demo at capuchin.help
Book a 30-min demo →Capuchin B.V. — Amsterdam, 2025.